Product News
Introducing Android Performance Analyzer - The Next Evolution in Profiling for Android
5-min read

What is Android Performance Analyzer?
Android Performance Analyzer (APA) is Android’s new profiler and performance analysis tool for the Android mobile ecosystem.
APA is intended as a profiling tool for any developer building for Android who needs to make their app or game run better and faster. It is helpful for all performance-minded engineers, especially those using Vulkan in their game engines who want to squeeze every bit of performance out of their code.
APA aims to be the tool that helps you optimize apps and games for all modern Android devices and simplifies your most common workflows, with a simple interface that anyone on your team can quickly learn and be productive.
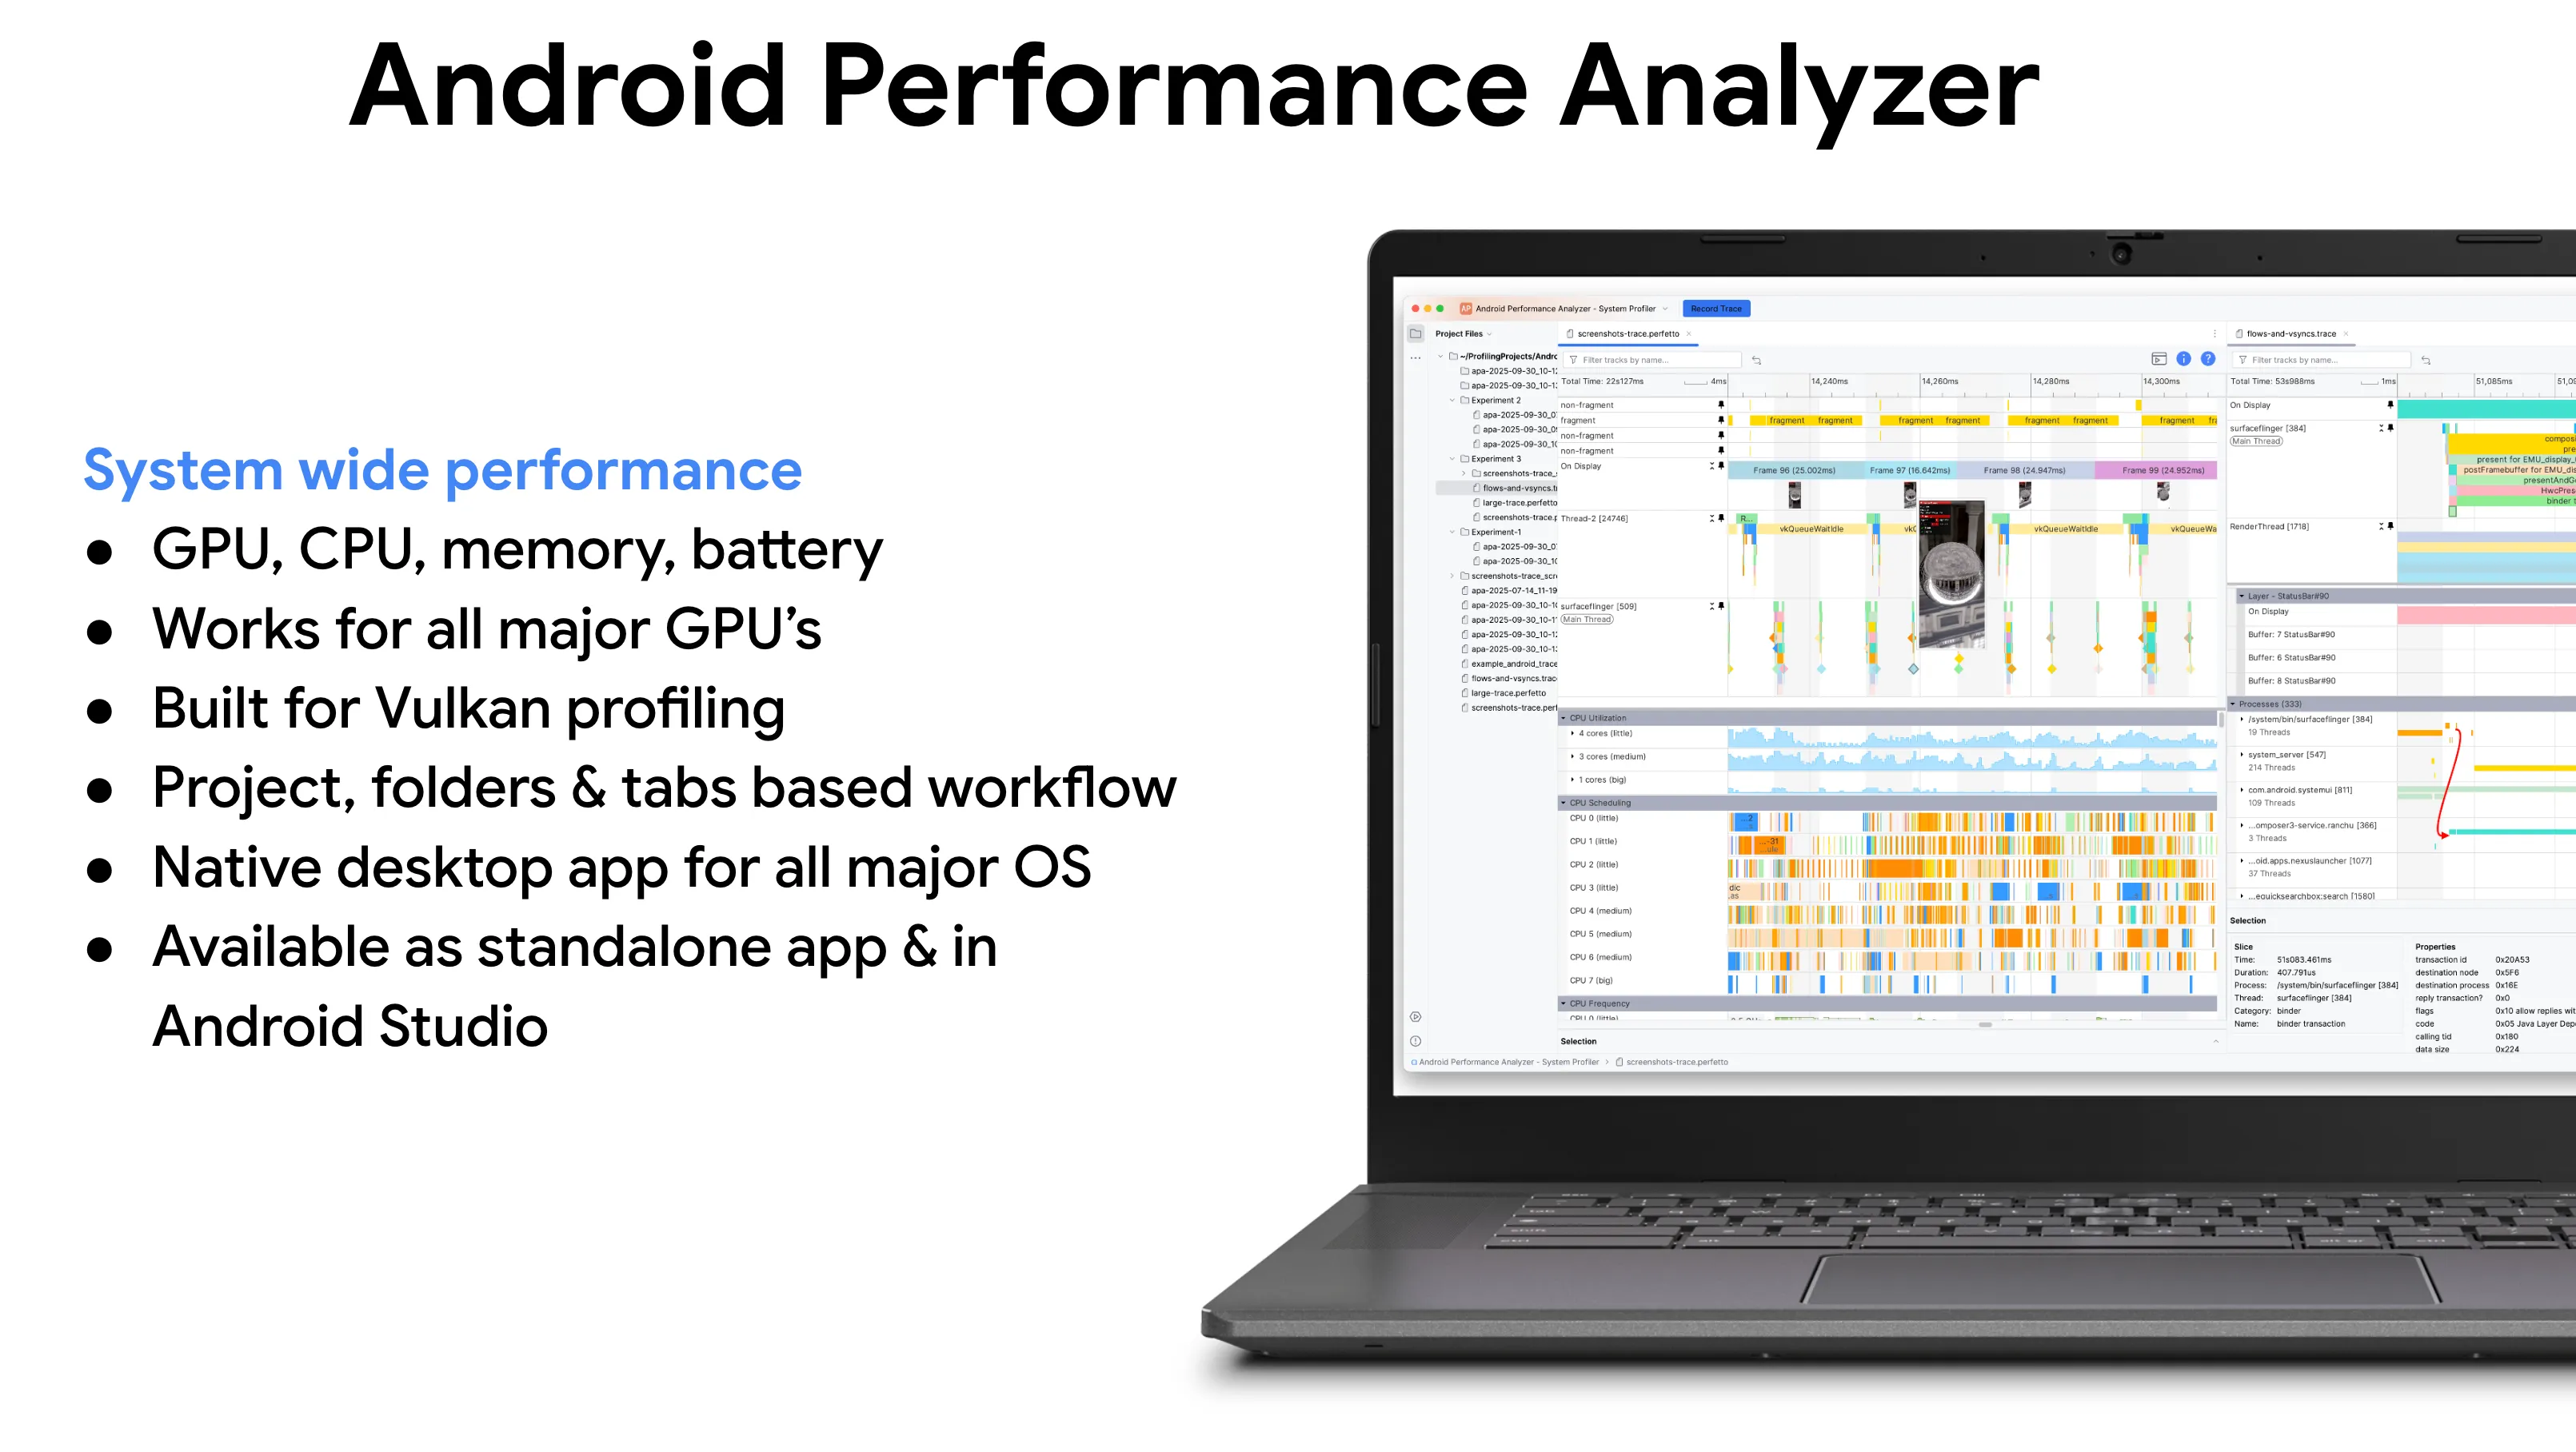
Available today in open beta is APA’s new System Profiler that you can use to analyze the CPU, GPU, Memory, and power usage of your app or game - and see how it interacts with system behavior.
Developed in collaboration with Samsung Austin Research Center (SARC) and LunarG, APA relies on Perfetto for system tracing and its upcoming frame profiling/debugging features (stay tuned!) are powered by LunarG’s GFXReconstruct technology for graphics capture and replay.
Devices running Android 12+ will provide the best experience for capturing system-wide performance and GPU counters and render stages.
We’re also working across the Android ecosystem with our esteemed industry partners to bring more profiling & optimization related data into APA.
How to get Android Performance Analyzer
APA ships in two different forms, and you can download whichever one suits your needs best
- As a lightweight standalone desktop app.
- And also integrated directly into Android Studio as the updated System Trace viewer (available in Panda 4 canary builds and later).
The standalone desktop app is intended to be used without an Android Studio project or Gradle build - and provides deep customization of recording configuration, built-in Vulkan layers for graphics analysis, deep inspection of GPU counters and much more.
APA is also cross-platform: works natively on Windows, MacOS, and Linux.
Features in this release
Basic profiling functionality
Capturing your profile data
You don’t always want to take a capture immediately at application or game launch. APA allows you to choose, and capture traces from your device at launch or triggered manually. The user interface allows you to select which GPU counters and other data is captured in a trace - and if you have more complex needs, you can provide your own custom Perfetto configuration.
Deep-Dive System Analysis
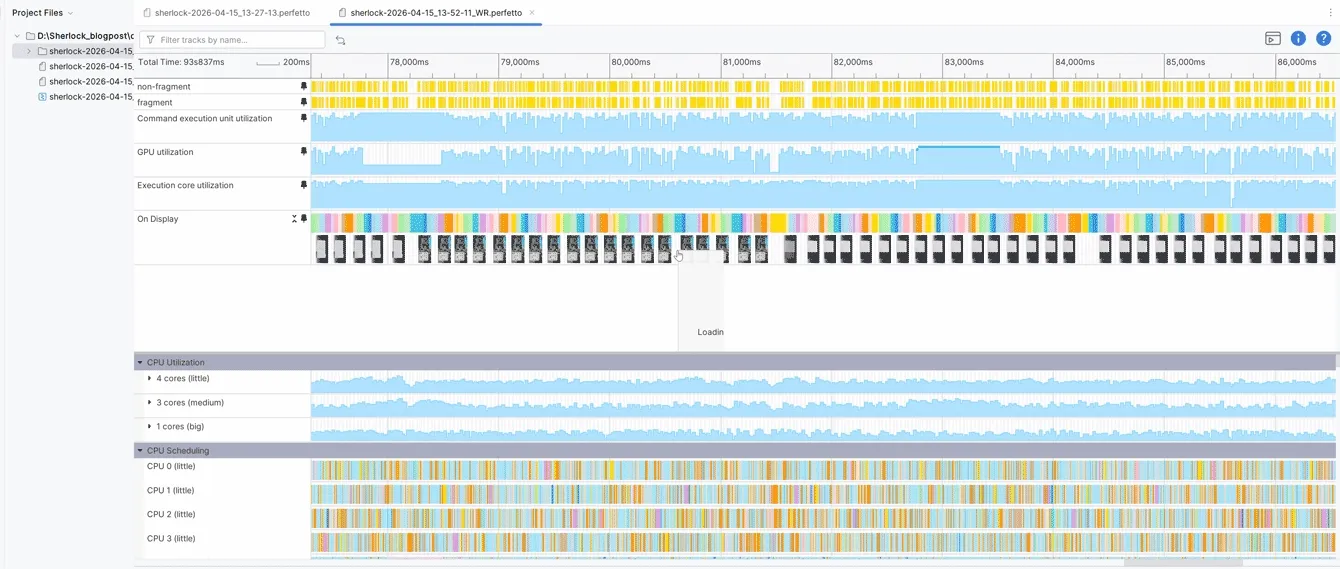
With APA, you can analyze the entire system’s behavior in one view. For example, you can easily examine CPU cores - both their frequencies and the work scheduled on them or inspect processes & their thread activity.
For graphics-heavy apps, APA provides GPU performance counter data across hardware from Qualcomm, Arm, Imagination, and Samsung. You can even track battery and power consumption to see the impact of your code on power consumption.
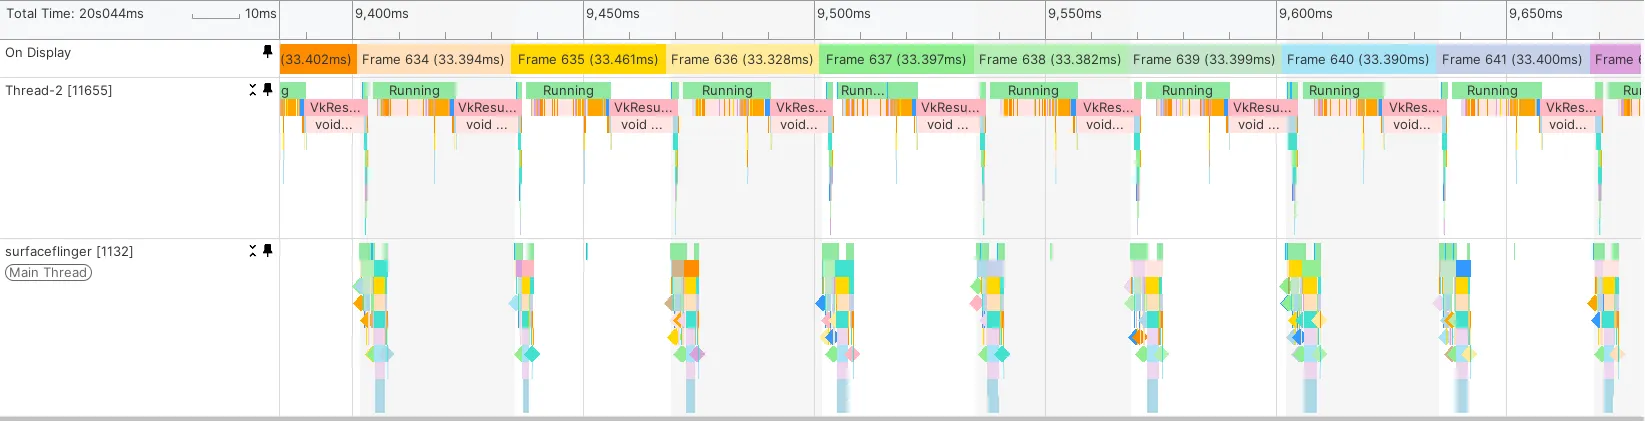
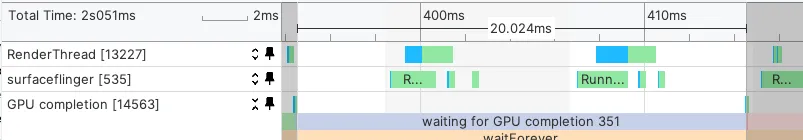
To understand exactly where frames are spending time, SurfaceFlinger events provide deep visibility into the rendering and display composition pipeline, from initial code acquisition to final display. And with the new screenshots feature, you can visually scrub through to easily find the exact areas where you want to focus your attention.
You can open existing Perfetto traces, zoom through the timeline for precise detail, and use rulers to measure the duration of work and events. APA also lets you bookmark and annotate interesting findings, and you can pin critical tracks to the top of your screen to keep your focus exactly where it needs to be as you optimize.
Workflow features
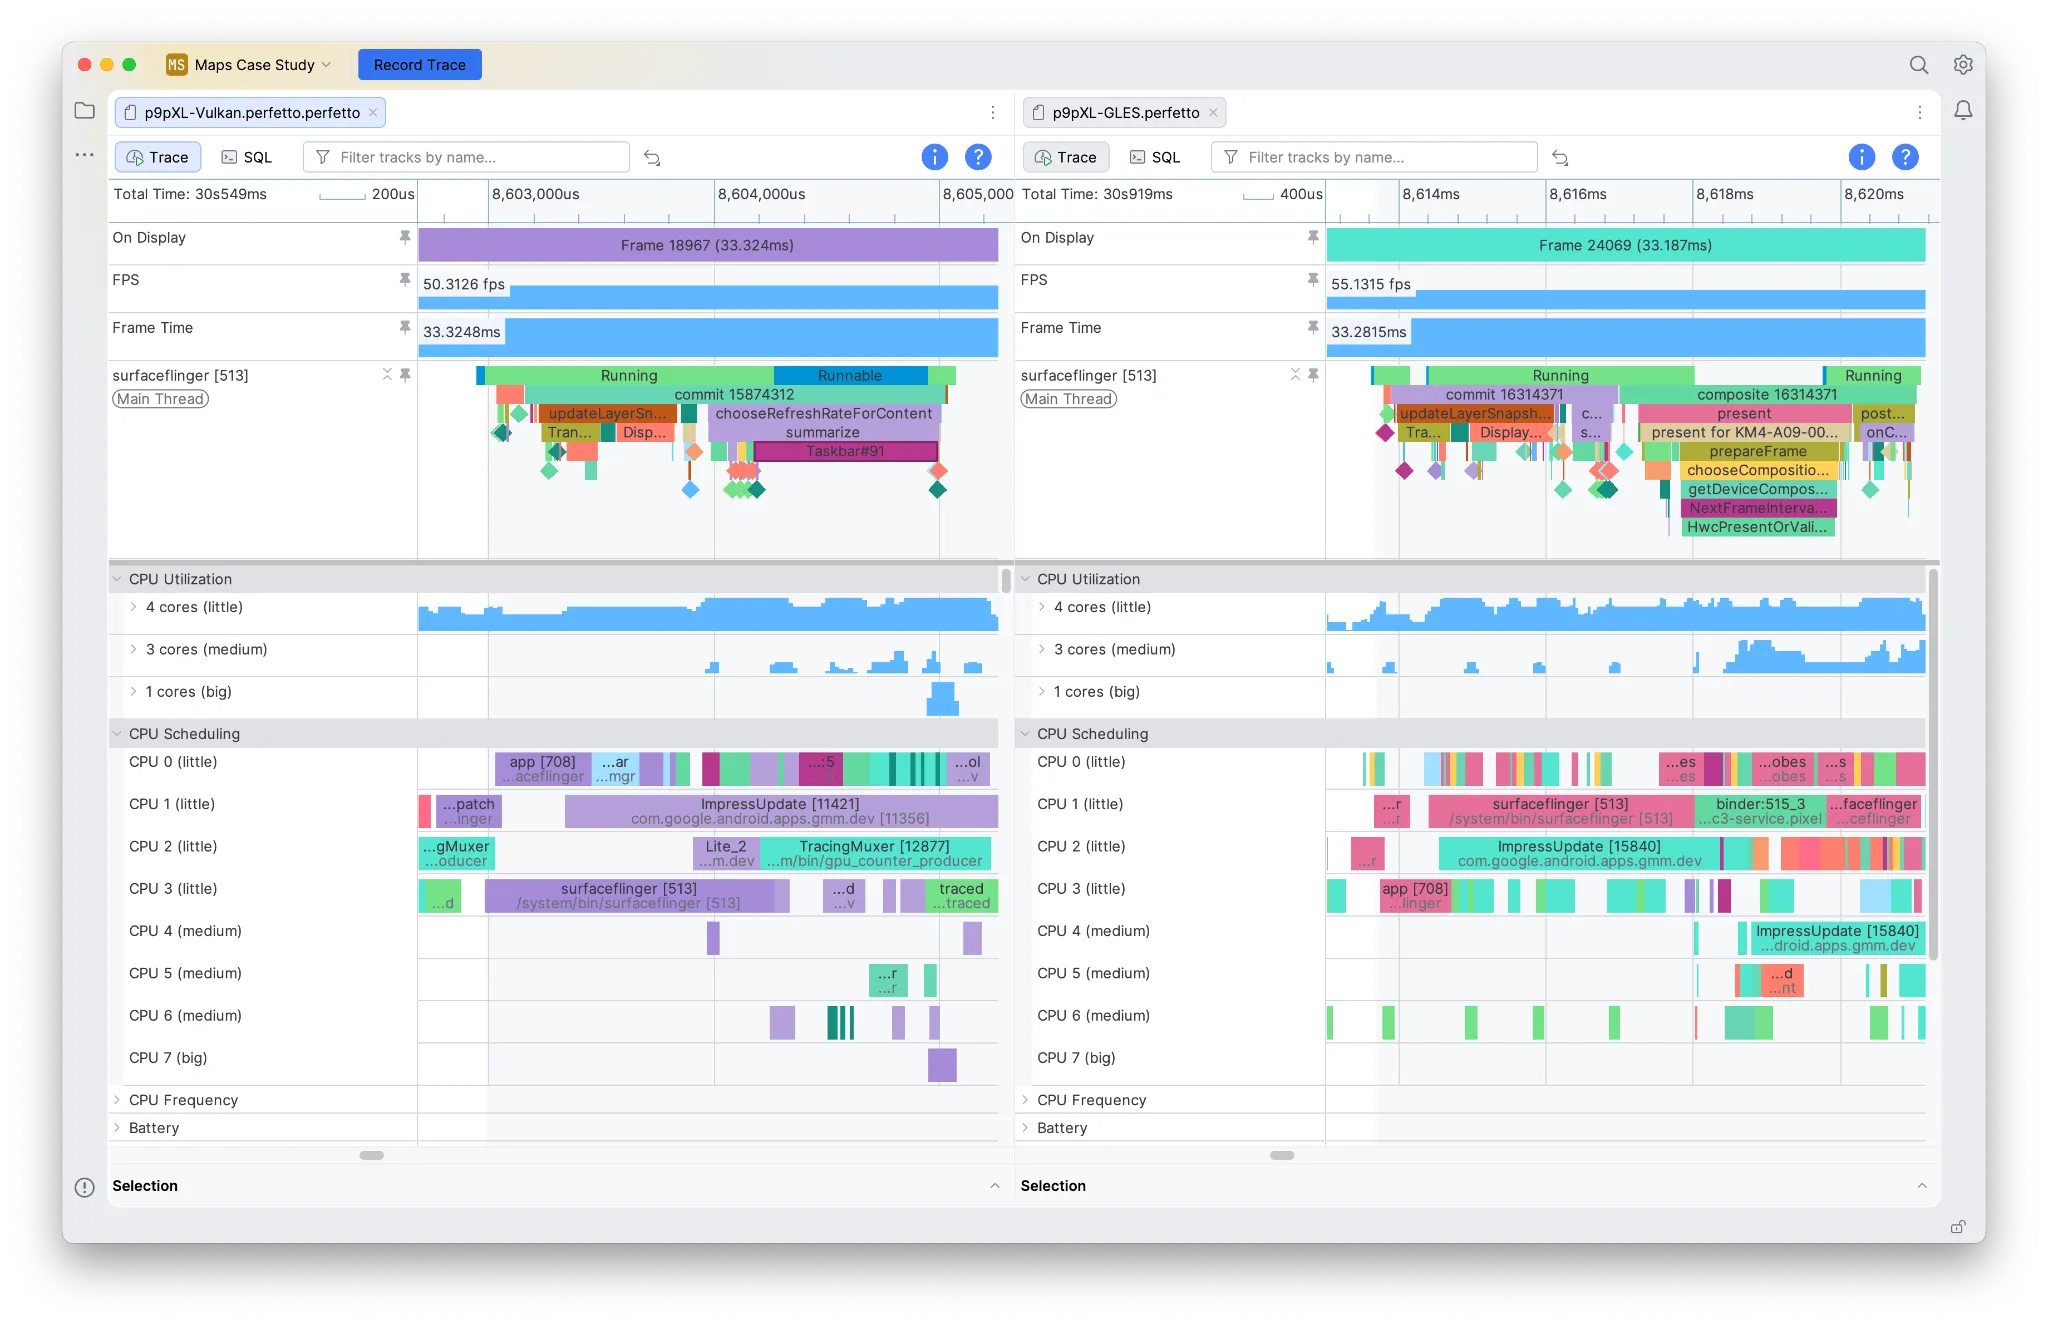
Tabbed interface and split windows: You can open multiple traces in side-by-side tabs or split a single trace into two windows to compare different regions of the same trace simultaneously.
Project-based workflow: APA uses a project model that allows you to keep track of multiple traces from the project sidebar. This is especially useful for gathering the results of A/B testing and longitudinal tests, and keeping all of your results together for comparison & quick access purposes.

Navigate visually using screenshots: APA lets you capture screenshots during a trace (without any noticeable performance overhead) to home in on areas where you saw something affect performance by scrubbing through the timeline. Or even just to get your bearings.
Persistent view customizations: When you pin or vertically resize tracks, we save those customizations so that they persist the next time you open the trace.
Analysis tools & new skills for AI agents
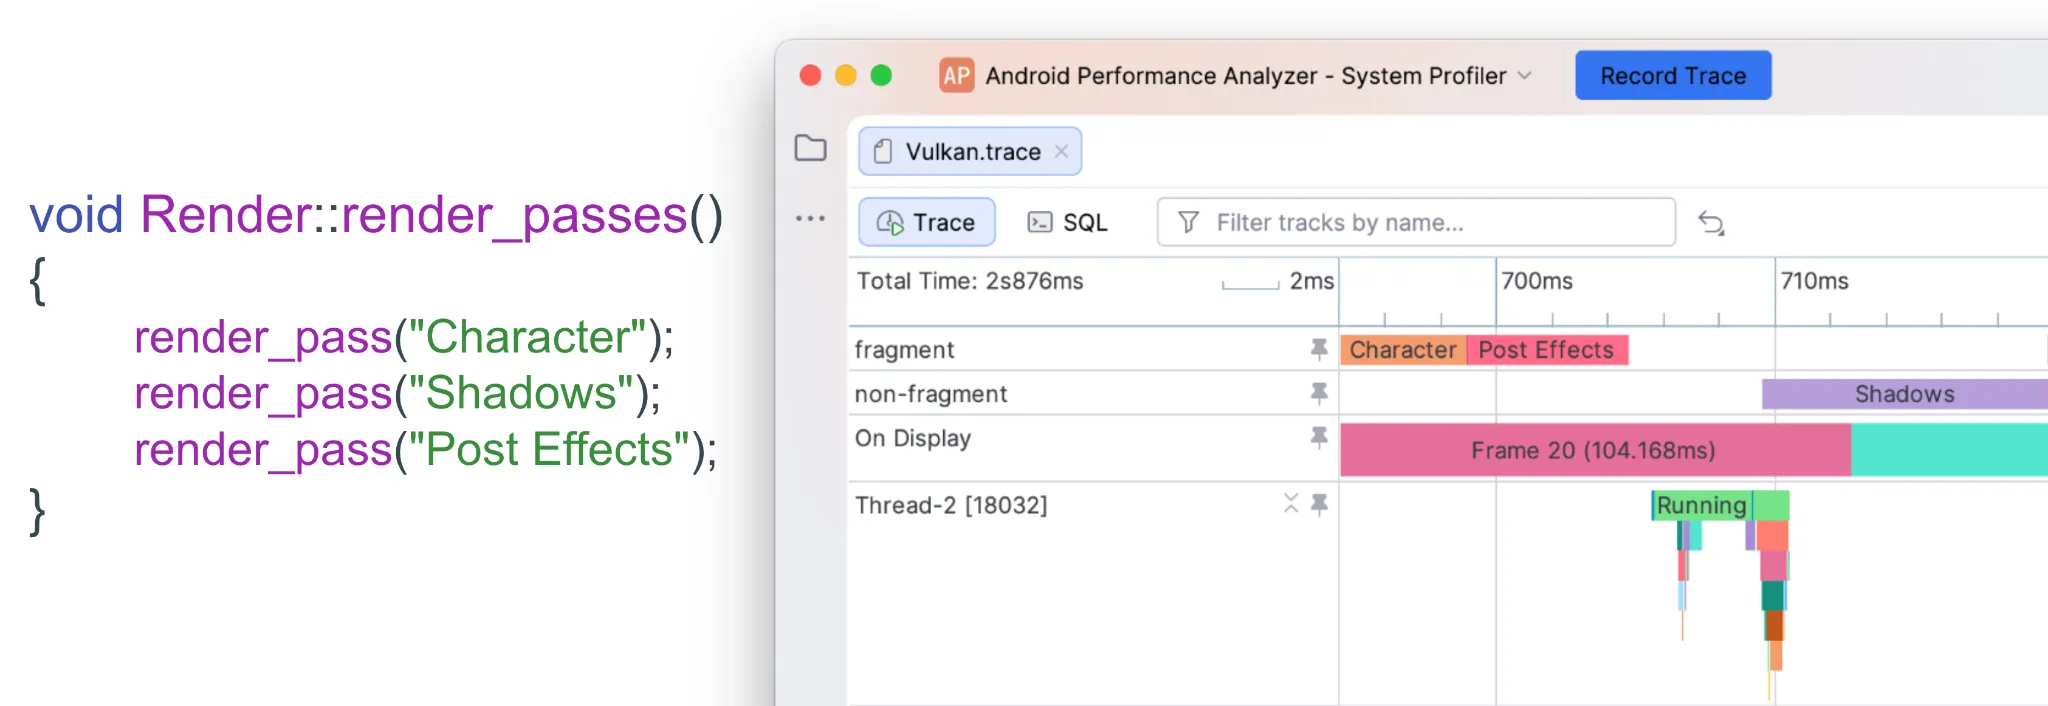
Vulkan debug trace markers for render passes: We support Vulkan debug annotations for render passes - which allow you to view Render Pass names you set from your codebase directly in the tracks and slices shown in APA.
This immensely helps you to make logical connections between the workloads you see in the profiler to where they are originating from in your codebase.
Use AI to build SQL queries for custom analysis work: APA supports trace analysis via SQL queries and ships with a new Perfetto SQL skill for use with your favorite AI agents. This makes it easier to build queries without needing to remember Perfetto SQL schemas or the SQL syntax.

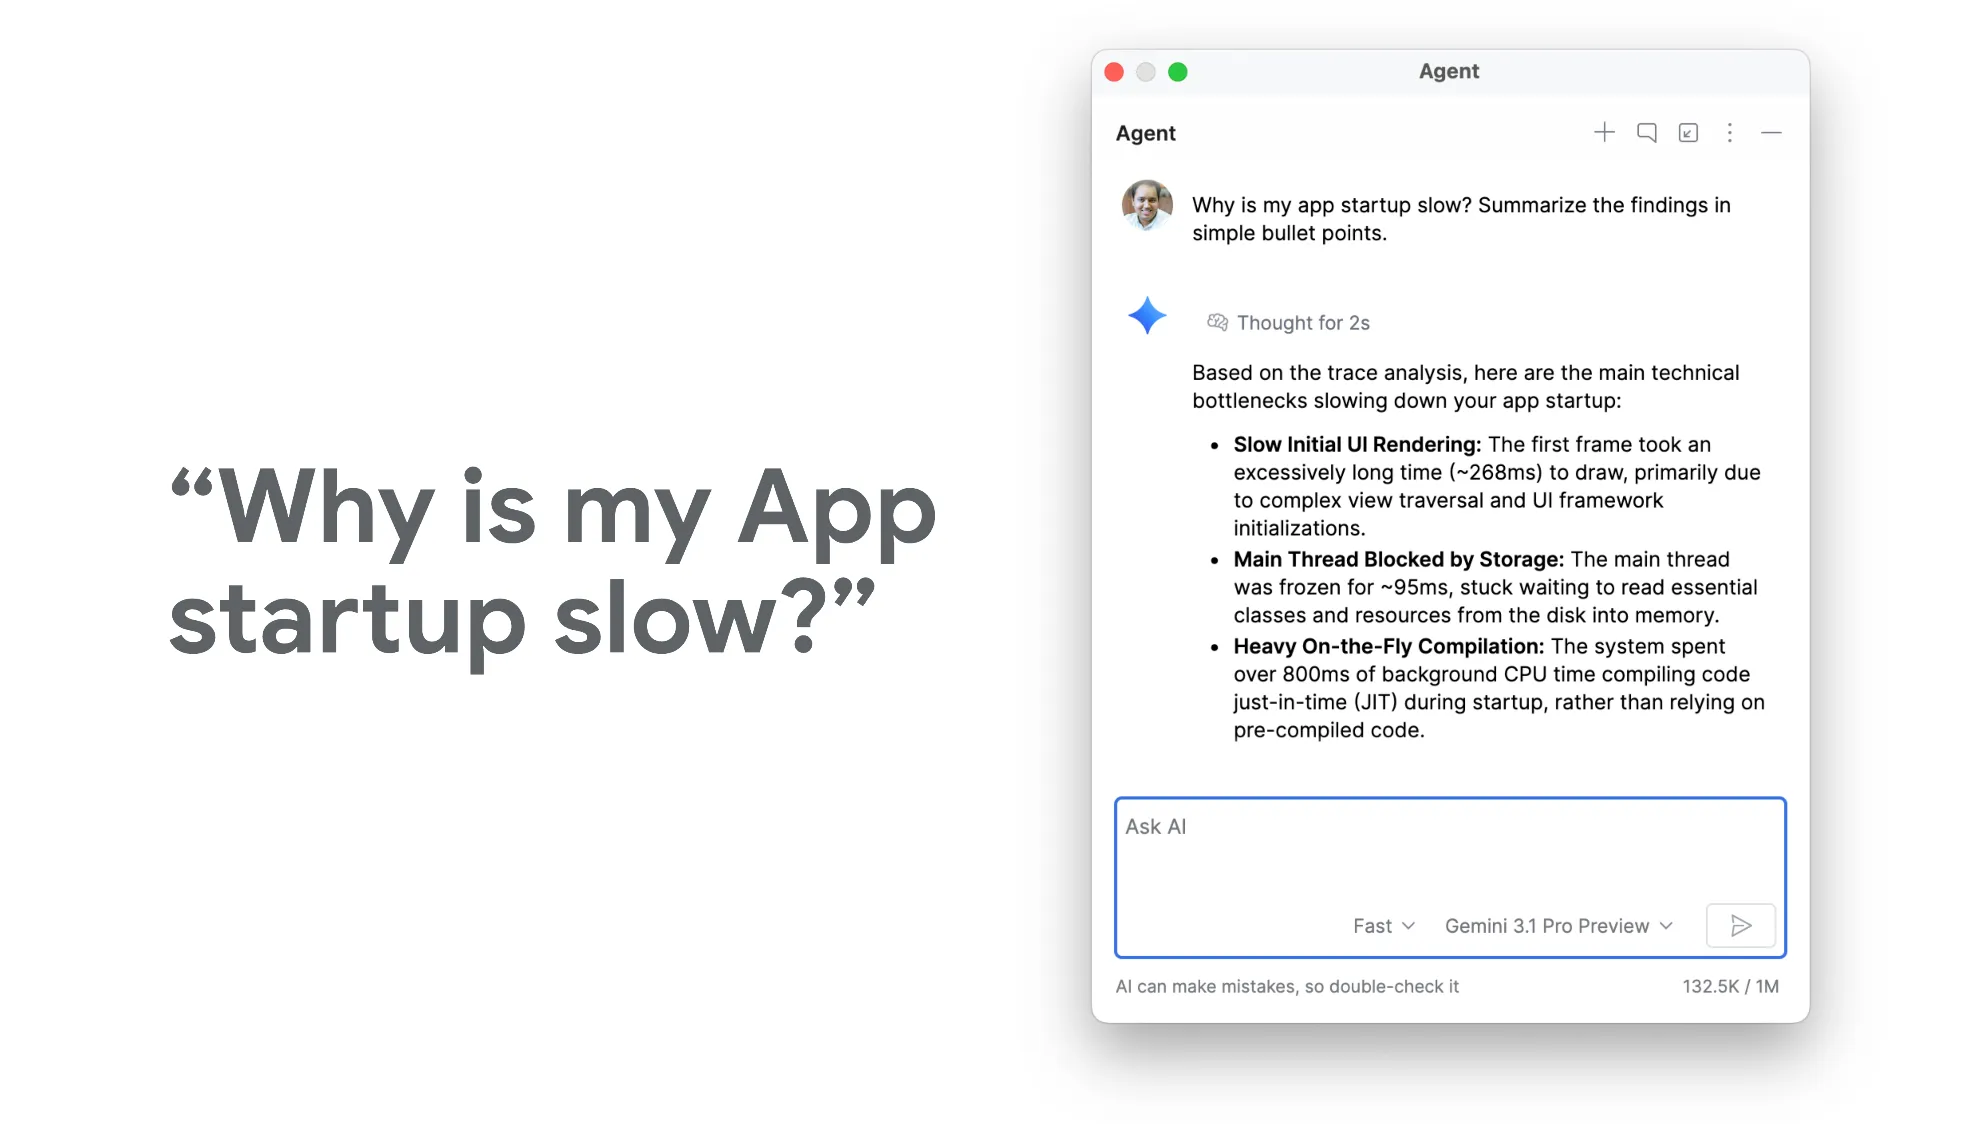
Ask Gemini to analyze traces for you: We’ve also added another Perfetto Analysis skill to answer high-level questions for you - like “Why is my app startup slow?” - helping you to find starting points when analyzing complex traces, using your favorite AI agent to pinpoint the answers.
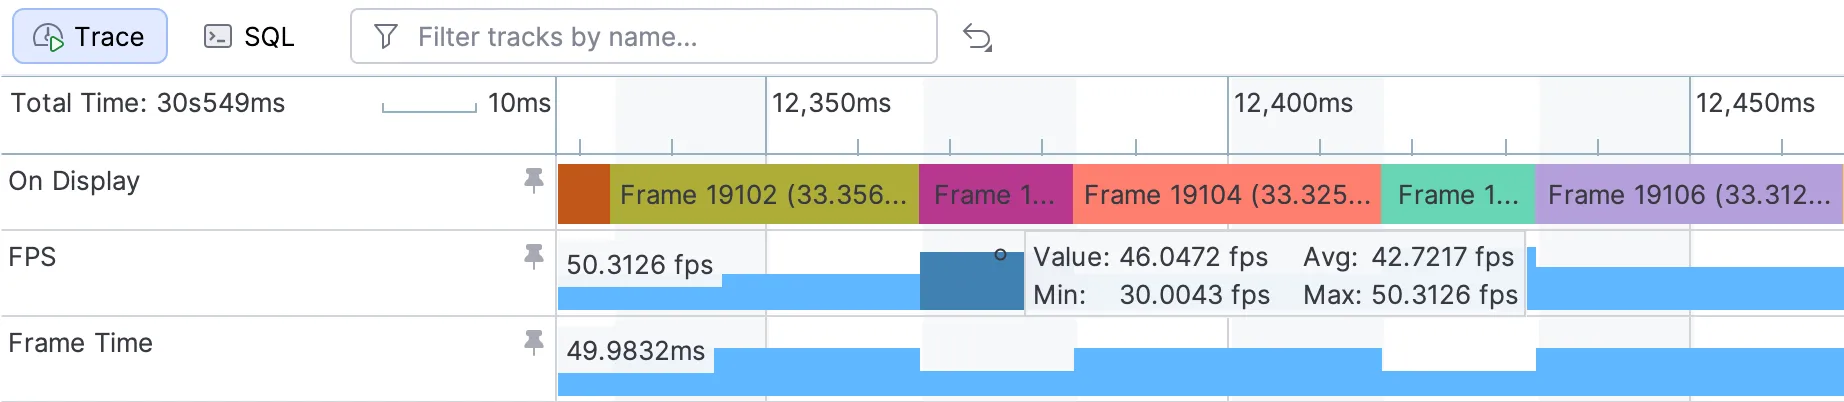
FPS and Frame Duration times : You can review the FPS and Frame duration time at a glance in the tracks to correlate it with other activity happening in your trace.
Speed & robustness improvements
Speed and robustness improvements: Rendering a trace is now typically 6x to 26x faster than Android GPU Inspector, and APA is significantly more stable when working with large traces.
Case studies
We’ve worked with our early access partners to create detailed case studies showcasing how APA could be used to improve performance for Vulkan apps & games.
The Forge Interactive
The Forge used Android Performance Analyzer to identify the need to batch calls to vkCmdBindDescriptorSets, which reduced CPU setup costs by ~50%. This, in turn, slowed heat production on their device by 2-3x, leading to longer session times. They also used APA to identify opportunities to move font and UI rendering work over to the GPU, improving scalability.
You can read the full case study from The Forge here.
Note: This case study demonstrates how to use custom SQL queries in the profiler to generate a total rendering cost metric.
NetMarble – Seven Deadly Sins: Origin
Netmarble used Android Performance Analyzer to fine-tune their game Seven Deadly Sins: Origin, focusing particularly on improving performance by making changes to the precision of their shaders, and exploring the impact of upscaling on the performance of their renderer.
This allowed them to reduce the GPU cost of rendering some scenes by up to 90%.
Read the full NetMarble case study here.

Profiling model complexity in Google’s Filament engine
Google has been improving the Filament glTF Viewer, our physically-based rendering engine.
We spent some time digging into the viewer with a variety of scenes, and showed how to use Android Performance Analyzer to identify scenes that are too complex for the GPU, and how to trim them down to hit a target 60FPS, by improving texture compression and optimizing geometry. Memory consumption was also reduced in this process.
You can read our exploration of Filament here.
Try out the Android Performance Analyzer Beta today!
The Android Performance Analyzer is available for you to try out and use today:
- Standalone profiler: https://da.cyanowen.top/android-performance-analyzer
- Android Studio Canary Build (Panda 4 canary builds and later): https://da.cyanowen.top/studio/preview
This is beta software, which means that you might run into an occasional bug – please report it to us if you find any (Help Menu > Submit a bug report).
We’re excited to see how you use the new Android Performance Analyzer, and how it will help your project’s performance and reliability.
Explore this announcement and all Google I/O 2026 updates on io.google.
Written by:
Continue reading
-

Product News
We're excited to launch Developer Preview 4 of the Android XR SDK, continuing our focus on unifying cross-device development for headsets, wired XR glasses, and intelligent eyewear.
-

Product News
Google I/O '26 features 17 key announcements for Android developers focusing on agent-led productivity, Compose First as our UI standard, and high-performance media and adaptive development for the expanding ecosystem.
Matthew McCullough • 8 min read
-
Product News
We're thrilled to see developers continuing to bring their apps and experiences to Android for Cars! Over the past year, we've continued to see strong growth and momentum in the app ecosystem on Android Auto and cars with Google built-in.
Jan Kleinert, Noam Gefen, Thomas Weathers • 3 min read
Stay in the loop
Get the latest Android development insights delivered to your inbox weekly.