
The System Profiler in Android Performance Analyzer exposes a wide range of useful data in the trace view. This guide provides a detailed description of the available trace data.
Tracks and track events
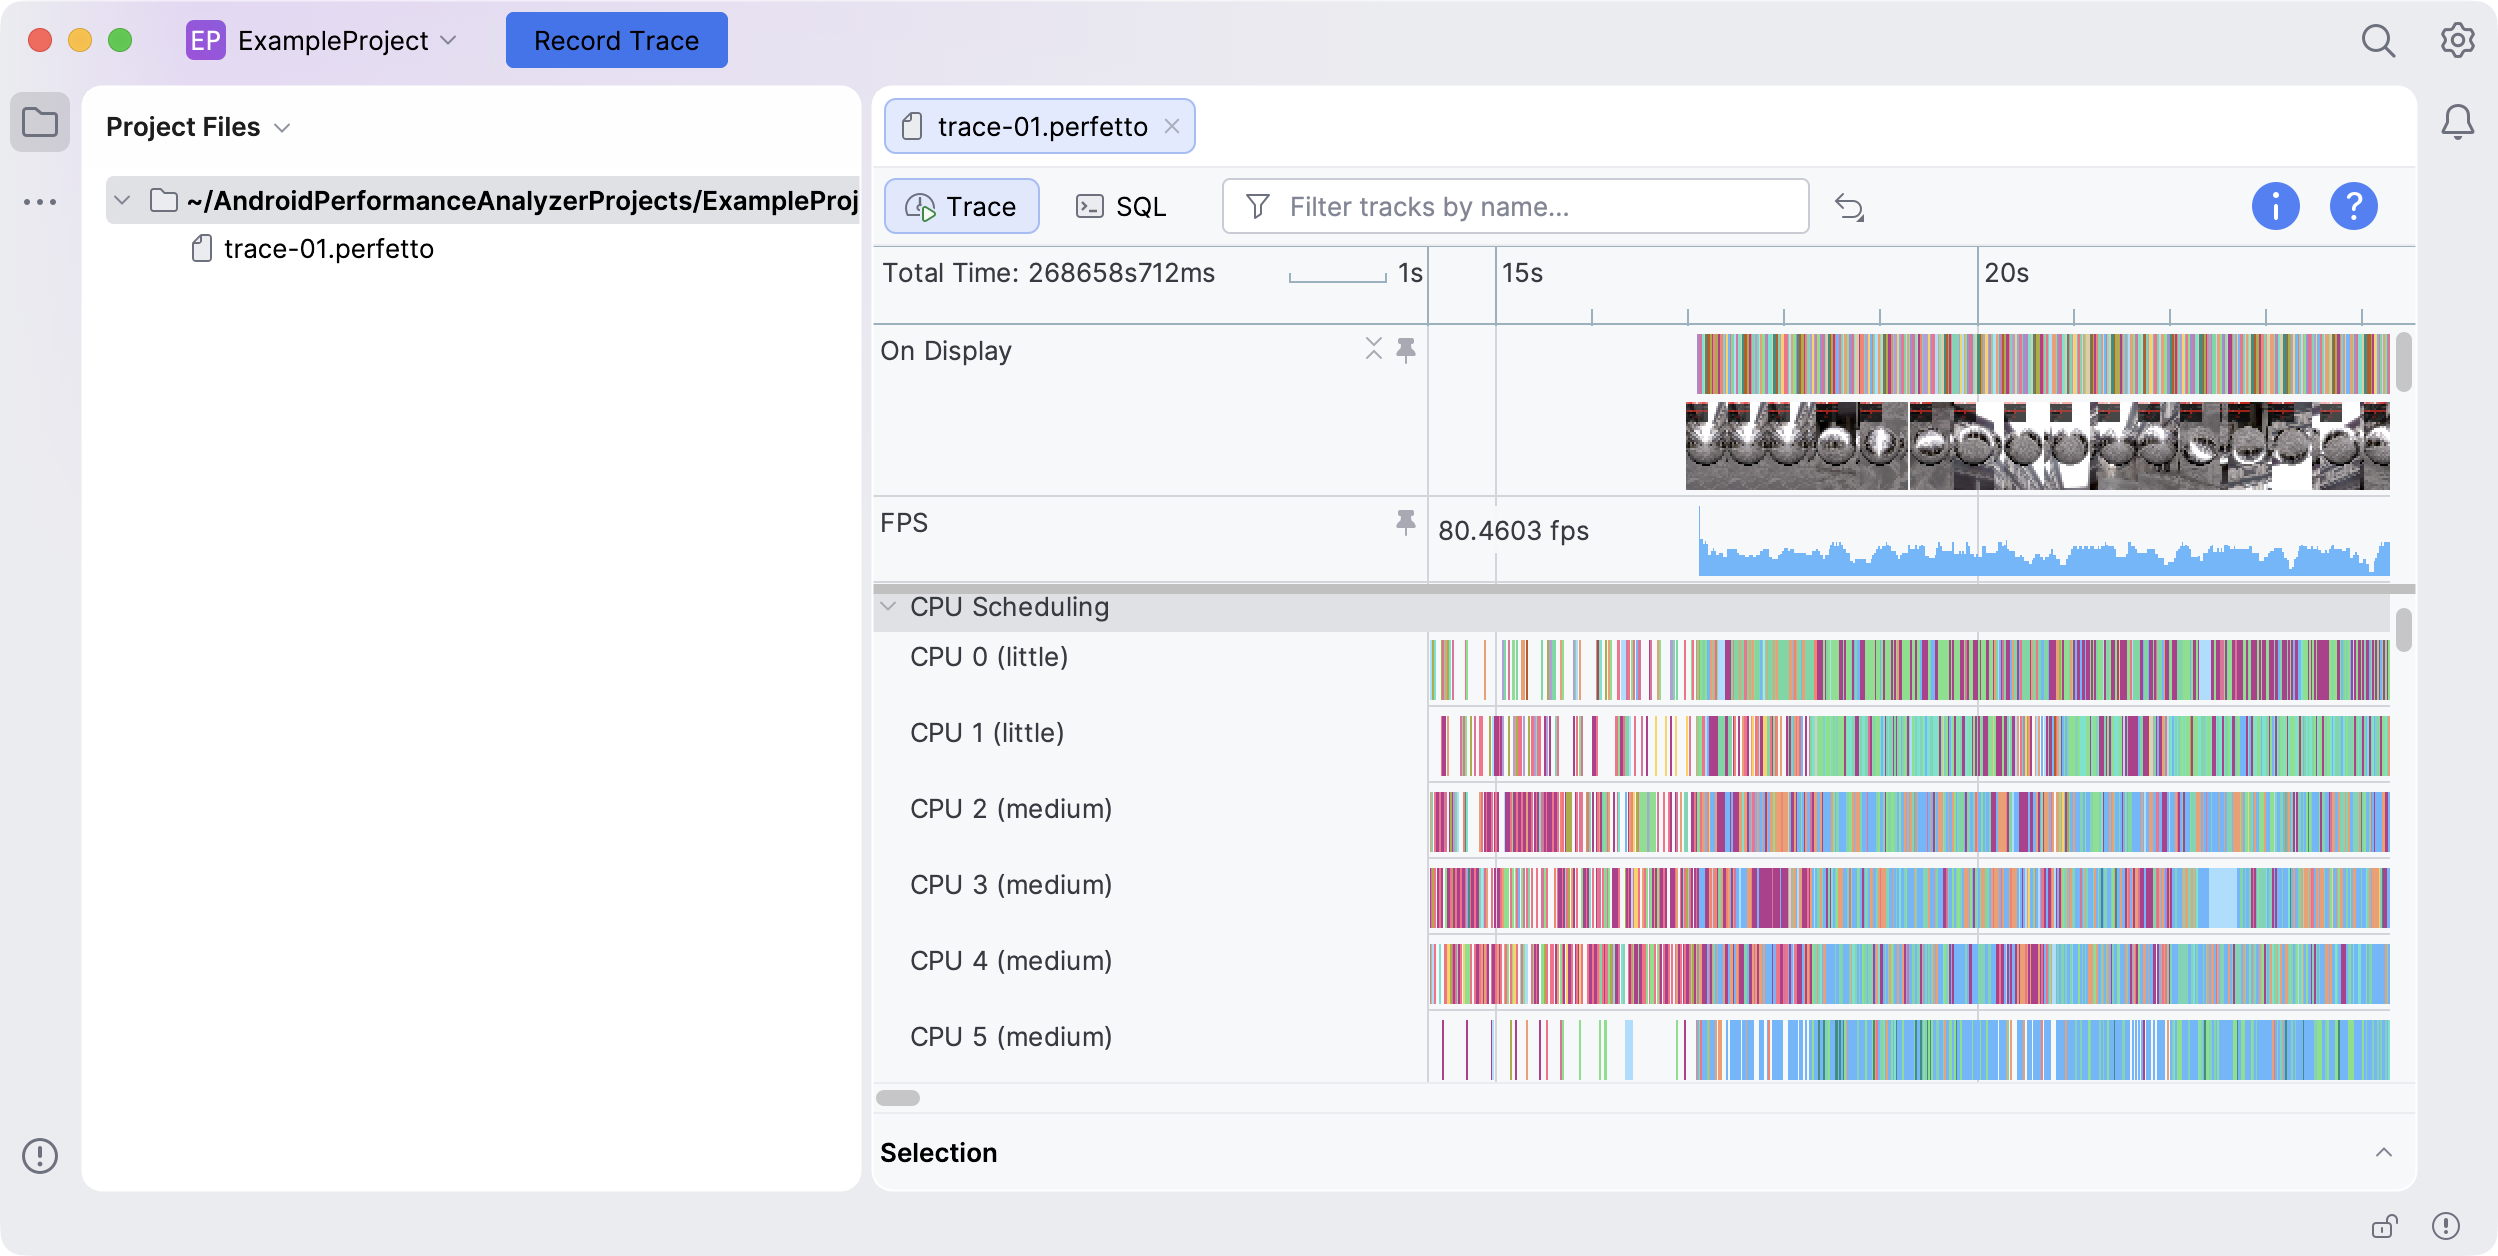
When you open a trace data file, the trace view displays all of the collected data in tracks. The horizontal axis in the trace view represents time, measured by the timeline bar at the top of the view. The timeline bar shows the total duration of the trace, identifies the period of time currently being displayed, and serves as a ruler to mark the timing of events. The timeline bar (and any pinned tracks) remain at the top of the trace view as you scroll up and down through the tracks.
Each track in the trace view contains track events that were recorded during the system trace. These track events come in three main types:
- Slices. These represent an operation and the period of time when it took place—for example, the time period from when a function begins executing to when it returns.
- Counters. These are snapshot measurements of numeric values, such as battery usage or CPU utilization.
- Flows. These connect related slices on different tracks. They're useful for tracking operations that span multiple tracks.
Profiling data
The tracks presented in the trace view are grouped into sections of related data.
To see general information about the trace, click
![]() View Trace Metadata.
View Trace Metadata.
CPU
The CPU Scheduling, CPU Utilization, and CPU Frequency sections contain tracks for each CPU core in the test device. Clicking on a slice within one of the tracks under CPU Scheduling opens a details panel with data about the process and thread it belongs to. You can cross-reference the PIDs and TIDs in this detail view with the tracks in the Processes section.
Battery usage
The Battery section contains a single Battery Usage track, which shows current in or out. Clicking an event within this track opens a details panel that also indicates charge and capacity. You can also hover over an event to see the exact measured values.
GPU metrics
The GPU section can contain a GPU Memory track, a GPU Queues subsection, a Vulkan Events track, and a GPU Counters subsection.
GPU memory
The GPU Memory track shows GPU memory usage in MB, as well as minimum, maximum, and average usage for the entire trace.
GPU queues
The GPU Queues subsection contains one or more tracks based on the number of hardware queues that ran during the trace. The events on these tracks represent the period and type of GPU work performed by your app.
Clicking on an event within one of these tracks opens a details panel with
additional data about that event. If the app under test uses Vulkan, this
metadata includes the Vulkan command buffer (VkCommandBuffer), render pass
(VkRenderPass), and frame buffer (VkFrameBuffer) that initiated the work.
Vulkan events
If the app under test uses Vulkan, the trace view includes a Vulkan Events
track that displays an event for each Vulkan submission (vkQueueSubmit calls).
Clicking on one of these events opens a details panel with additional data about
that event, in particular the associated submission_id. It also automatically
selects slices on the GPU Queues tracks that have the same submission_id.
GPU counters
The GPU Counters subsection contains a track for each of the configured counters. Each track graphs the value of a GPU counter sampled at regular intervals. These graphs help you identify variations in the performance of your GPU's underlying hardware components. You can use this info to identify bottlenecks in your GPU usage.
For more information about GPU performance counters, see the OEM documentation for your GPU.
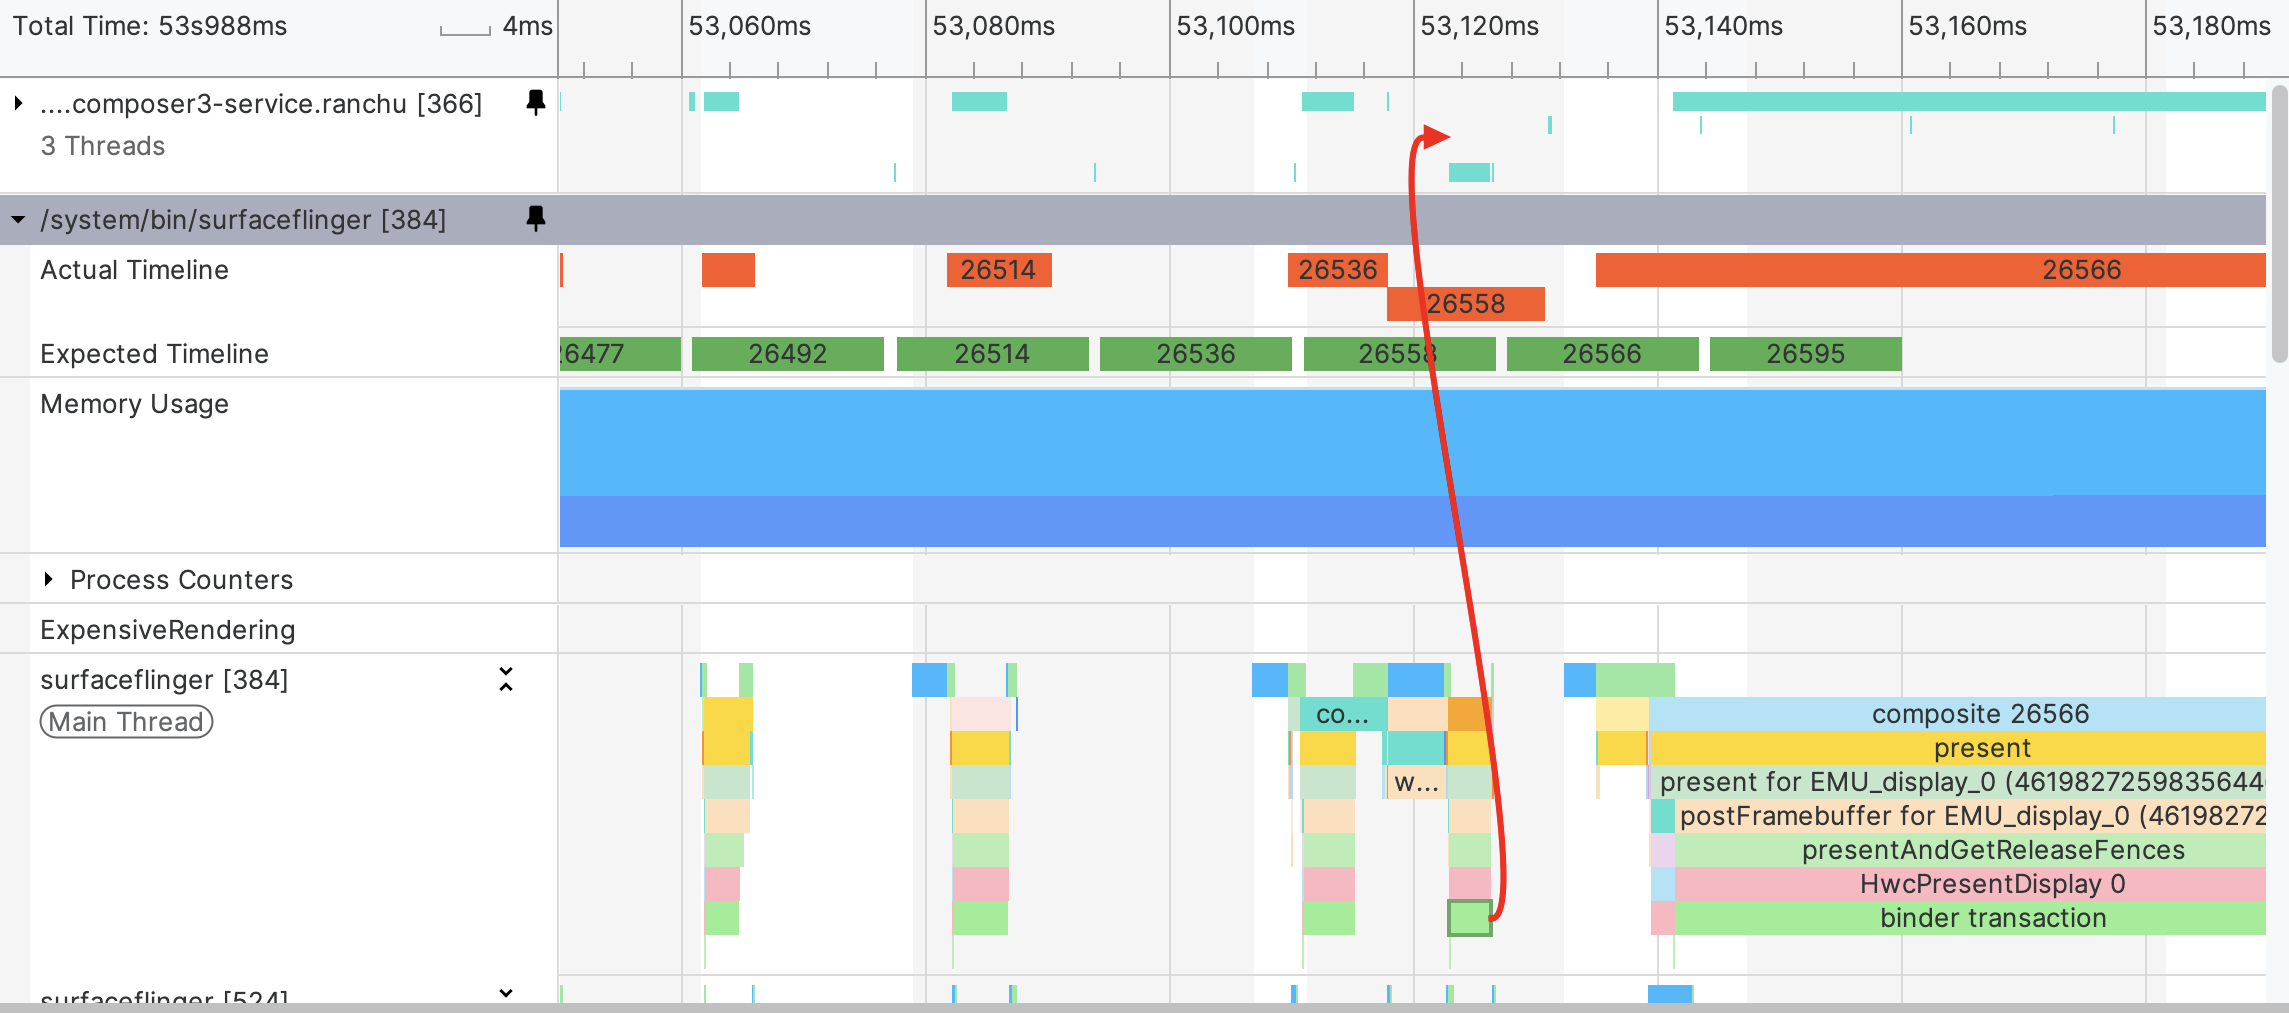
SurfaceFlinger events
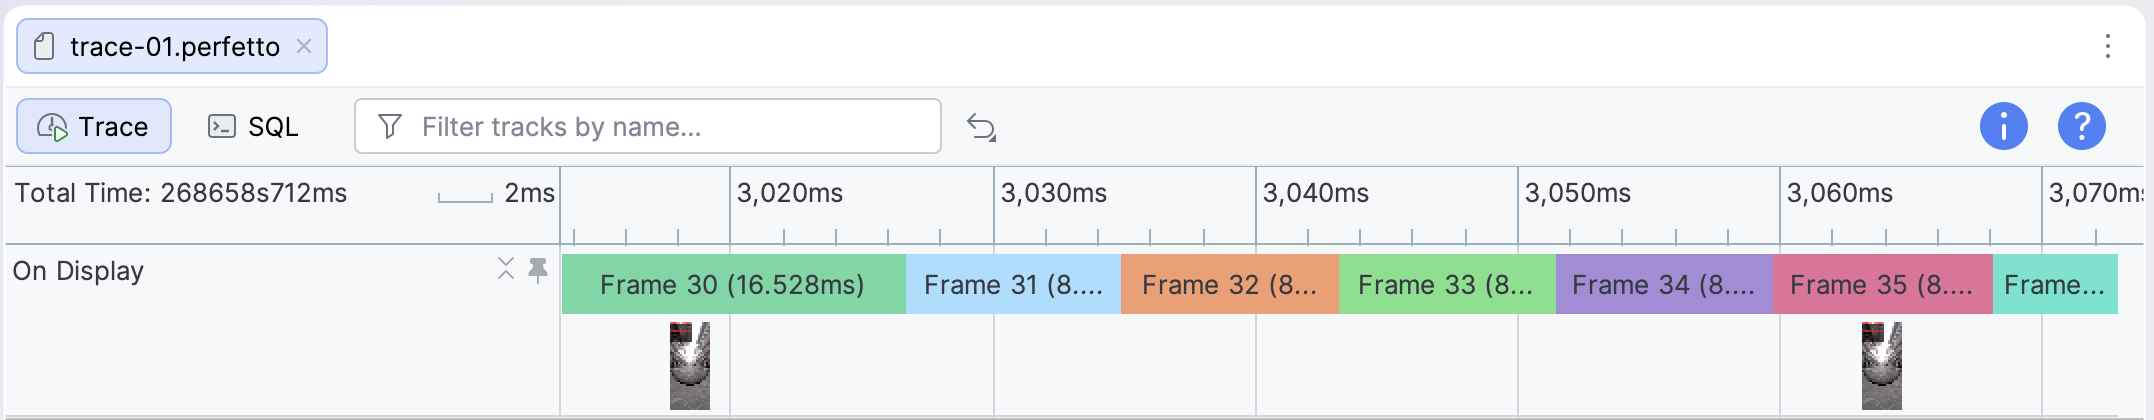
The SurfaceFlinger Events section includes subsections for each layer, displaying the lifecycle of graphics buffers until they're displayed. Each of these subsections includes an On Display track and a track for each active buffer. Each of these tracks contains frames that you can click to display a details view with additional data about that frame.
Screenshots
If you enabled the screenshots options when configuring your trace, the collected frame screenshots appear below the On Display track.
Processes
The Processes section includes a track for each process running on the test device during the test period. Clicking an event within one of these tracks opens a details panel with a list of active threads for that process at that time.
When collapsed, a process track shows a summary of when the threads for that process were scheduled to run for each CPU core.
You can further expand each process track into a subsection of tracks for each thread belonging to that process, as well as expandable track sections for Process Counters and Process Async Events. Clicking an event within a thread track opens a details panel with data about that thread.
Jank visualization
Slices for janky frames on the Actual Timeline tracks are color-coded by severity. Selecting the slice for a janky frame displays additional detail on the jank detected for that frame.