
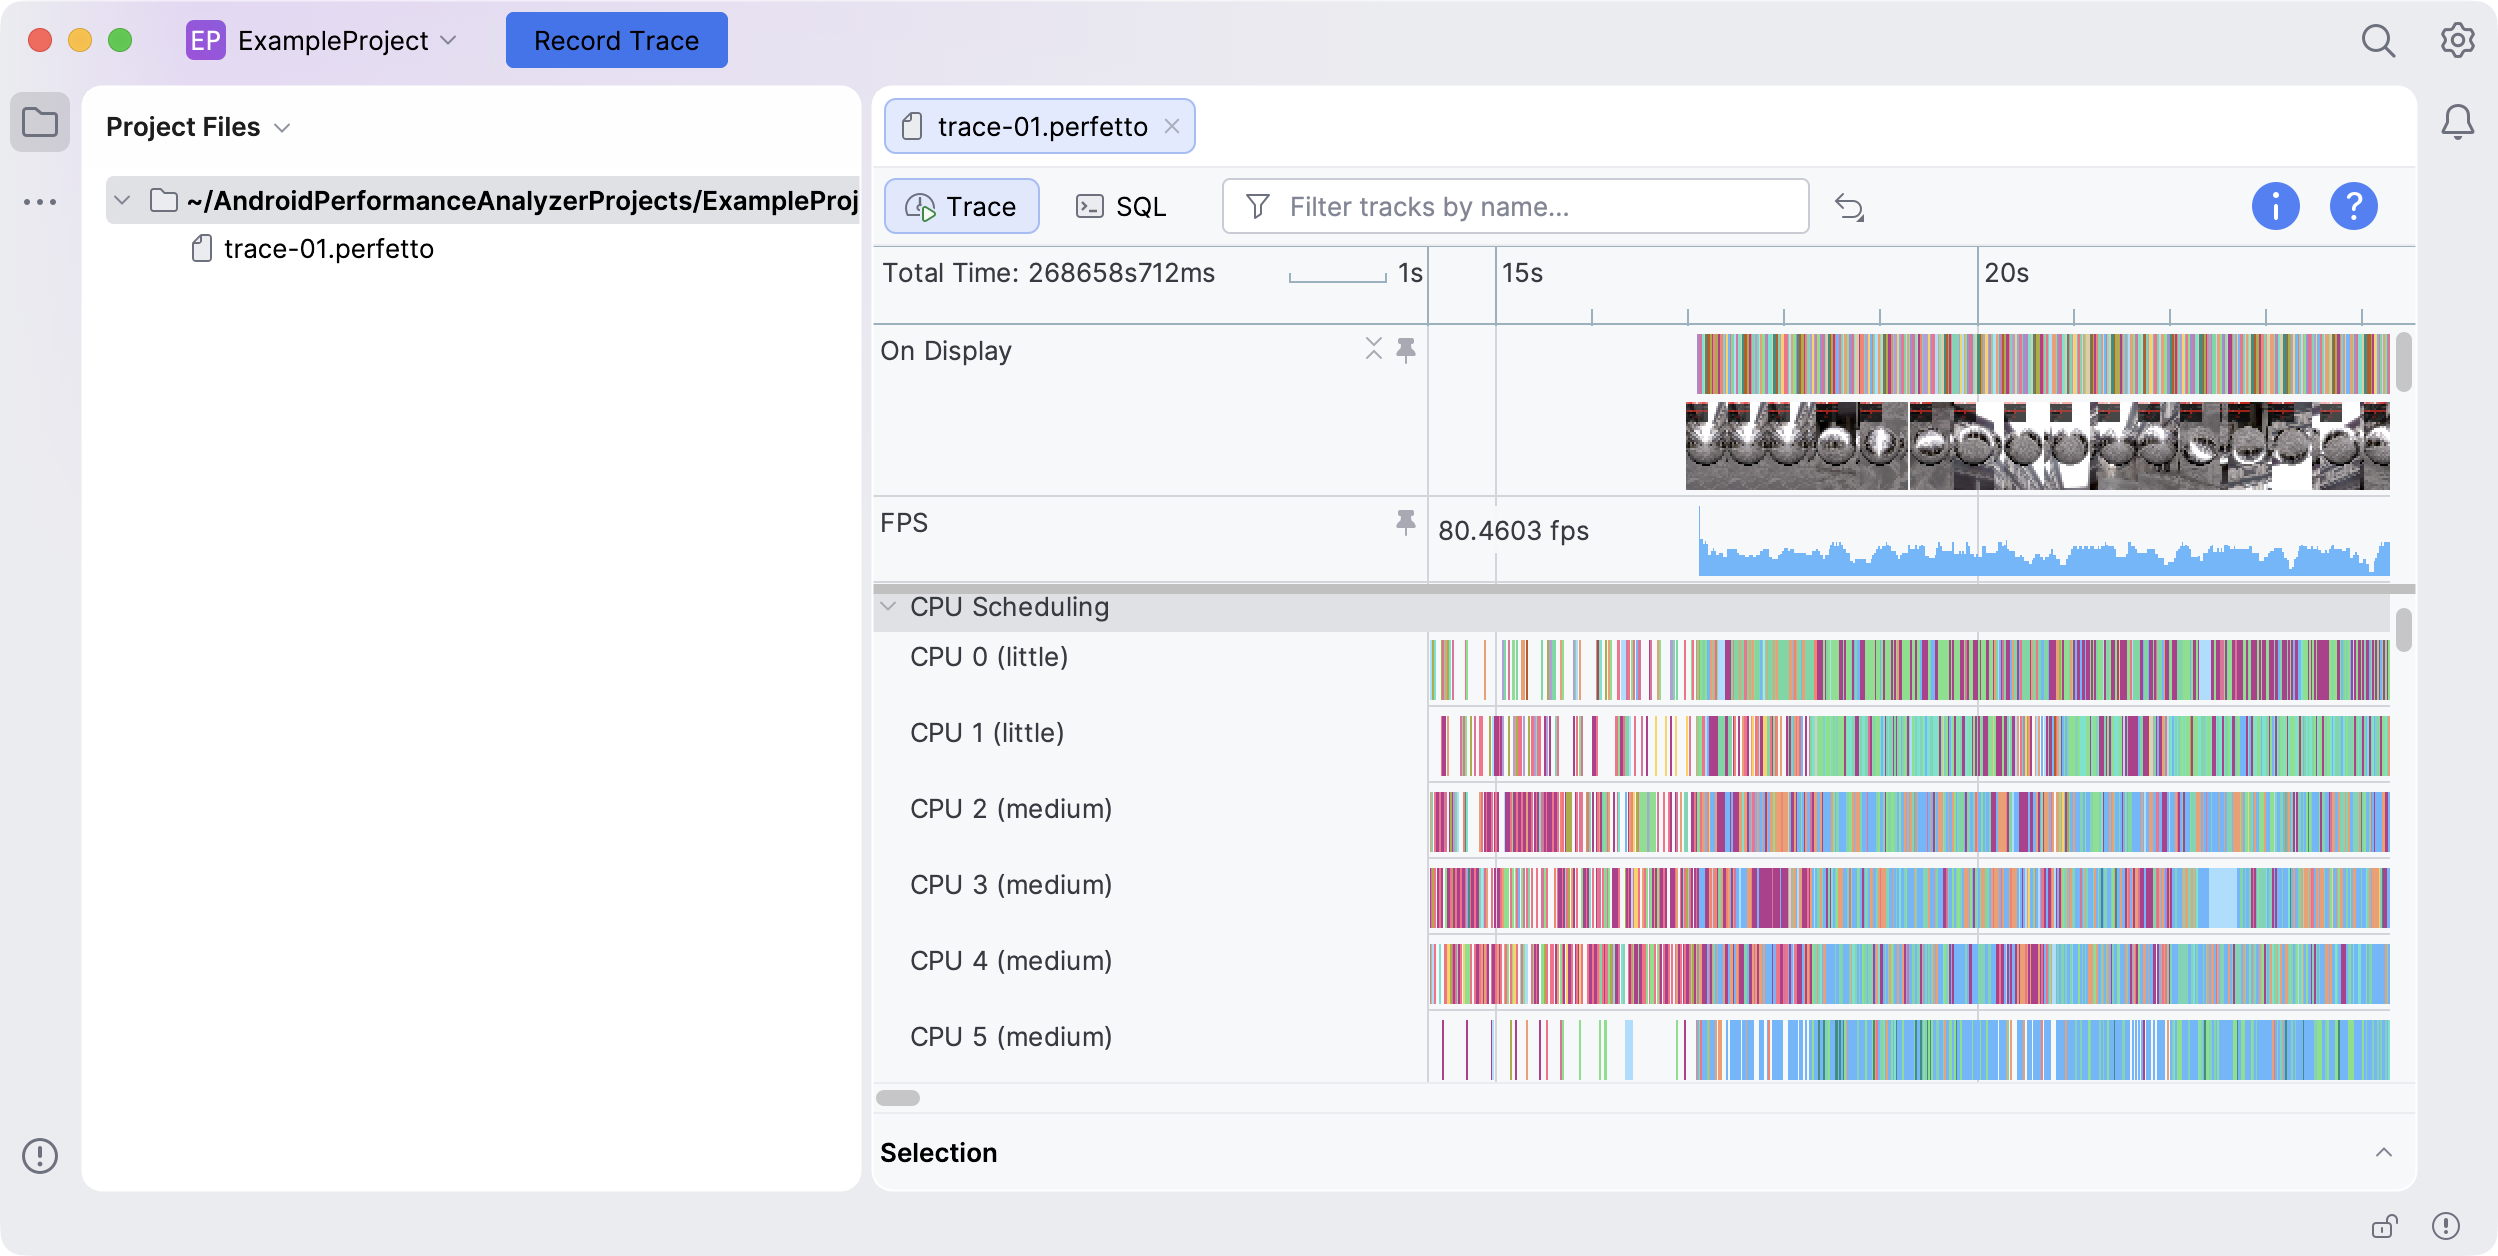
You can view any system traces that you've recorded previously in the System Profiler in Android Performance Analyzer. This guide demonstrates how to use the trace view to interact with recorded data. For a detailed description of the data presented in the trace view, see Understand trace data.
Navigate the trace view
The trace view provides a variety of ways to interact with the recorded data for
quick, intuitive analysis, as well as support for custom
queries. Click
![]() View Keyboard Mouse Shortcuts in the top-right corner of the trace view for
a list of keyboard and mouse hotkeys.
View Keyboard Mouse Shortcuts in the top-right corner of the trace view for
a list of keyboard and mouse hotkeys.
Filter tracks by name
You can type in the Filter tracks by name field in the top-left corner of the trace view to filter expanded tracks down to just the tracks with a name matching the search string.
Scroll, pan, and zoom
You can use the following keyboard shortcuts to navigate the trace view:
- A and D (or Left and Right) to pan back and forth in the timeline.
- W and S to zoom in or out.
- Up and Down to scroll vertically.
- Hold Shift while using any of these shortcuts to speed up navigation.
You can also navigate by clicking and dragging, by using the scrollbars on the right and bottom sides of the trace view, or by scrolling horizontally and vertically with your trackpad or mouse wheel.
When you open a trace file for the first time, it starts fully zoomed-out so that the entire timeline is visible. To zoom in or back out again, use W and S on the keyboard.
View details
Click an event on any track to open a details panel that presents a more detailed view of the data collected for that event.
To close a details panel, either click the collapse icon at the top-right of the panel or press the Esc key.
Select a time range
You can select a time range by either clicking and dragging on the timeline bar at the top of the trace view or by clicking and dragging anywhere in the trace view while holding Ctrl (Cmd on macOS).
To deselect a time range, click anywhere in the trace view outside of the selected slice.
Box-select items
You can click and drag a time range across multiple tracks while holding Shift to box-select items within that time range for all included tracks.
This also opens a details panel with a tabbed view of tables that contain all selected items.
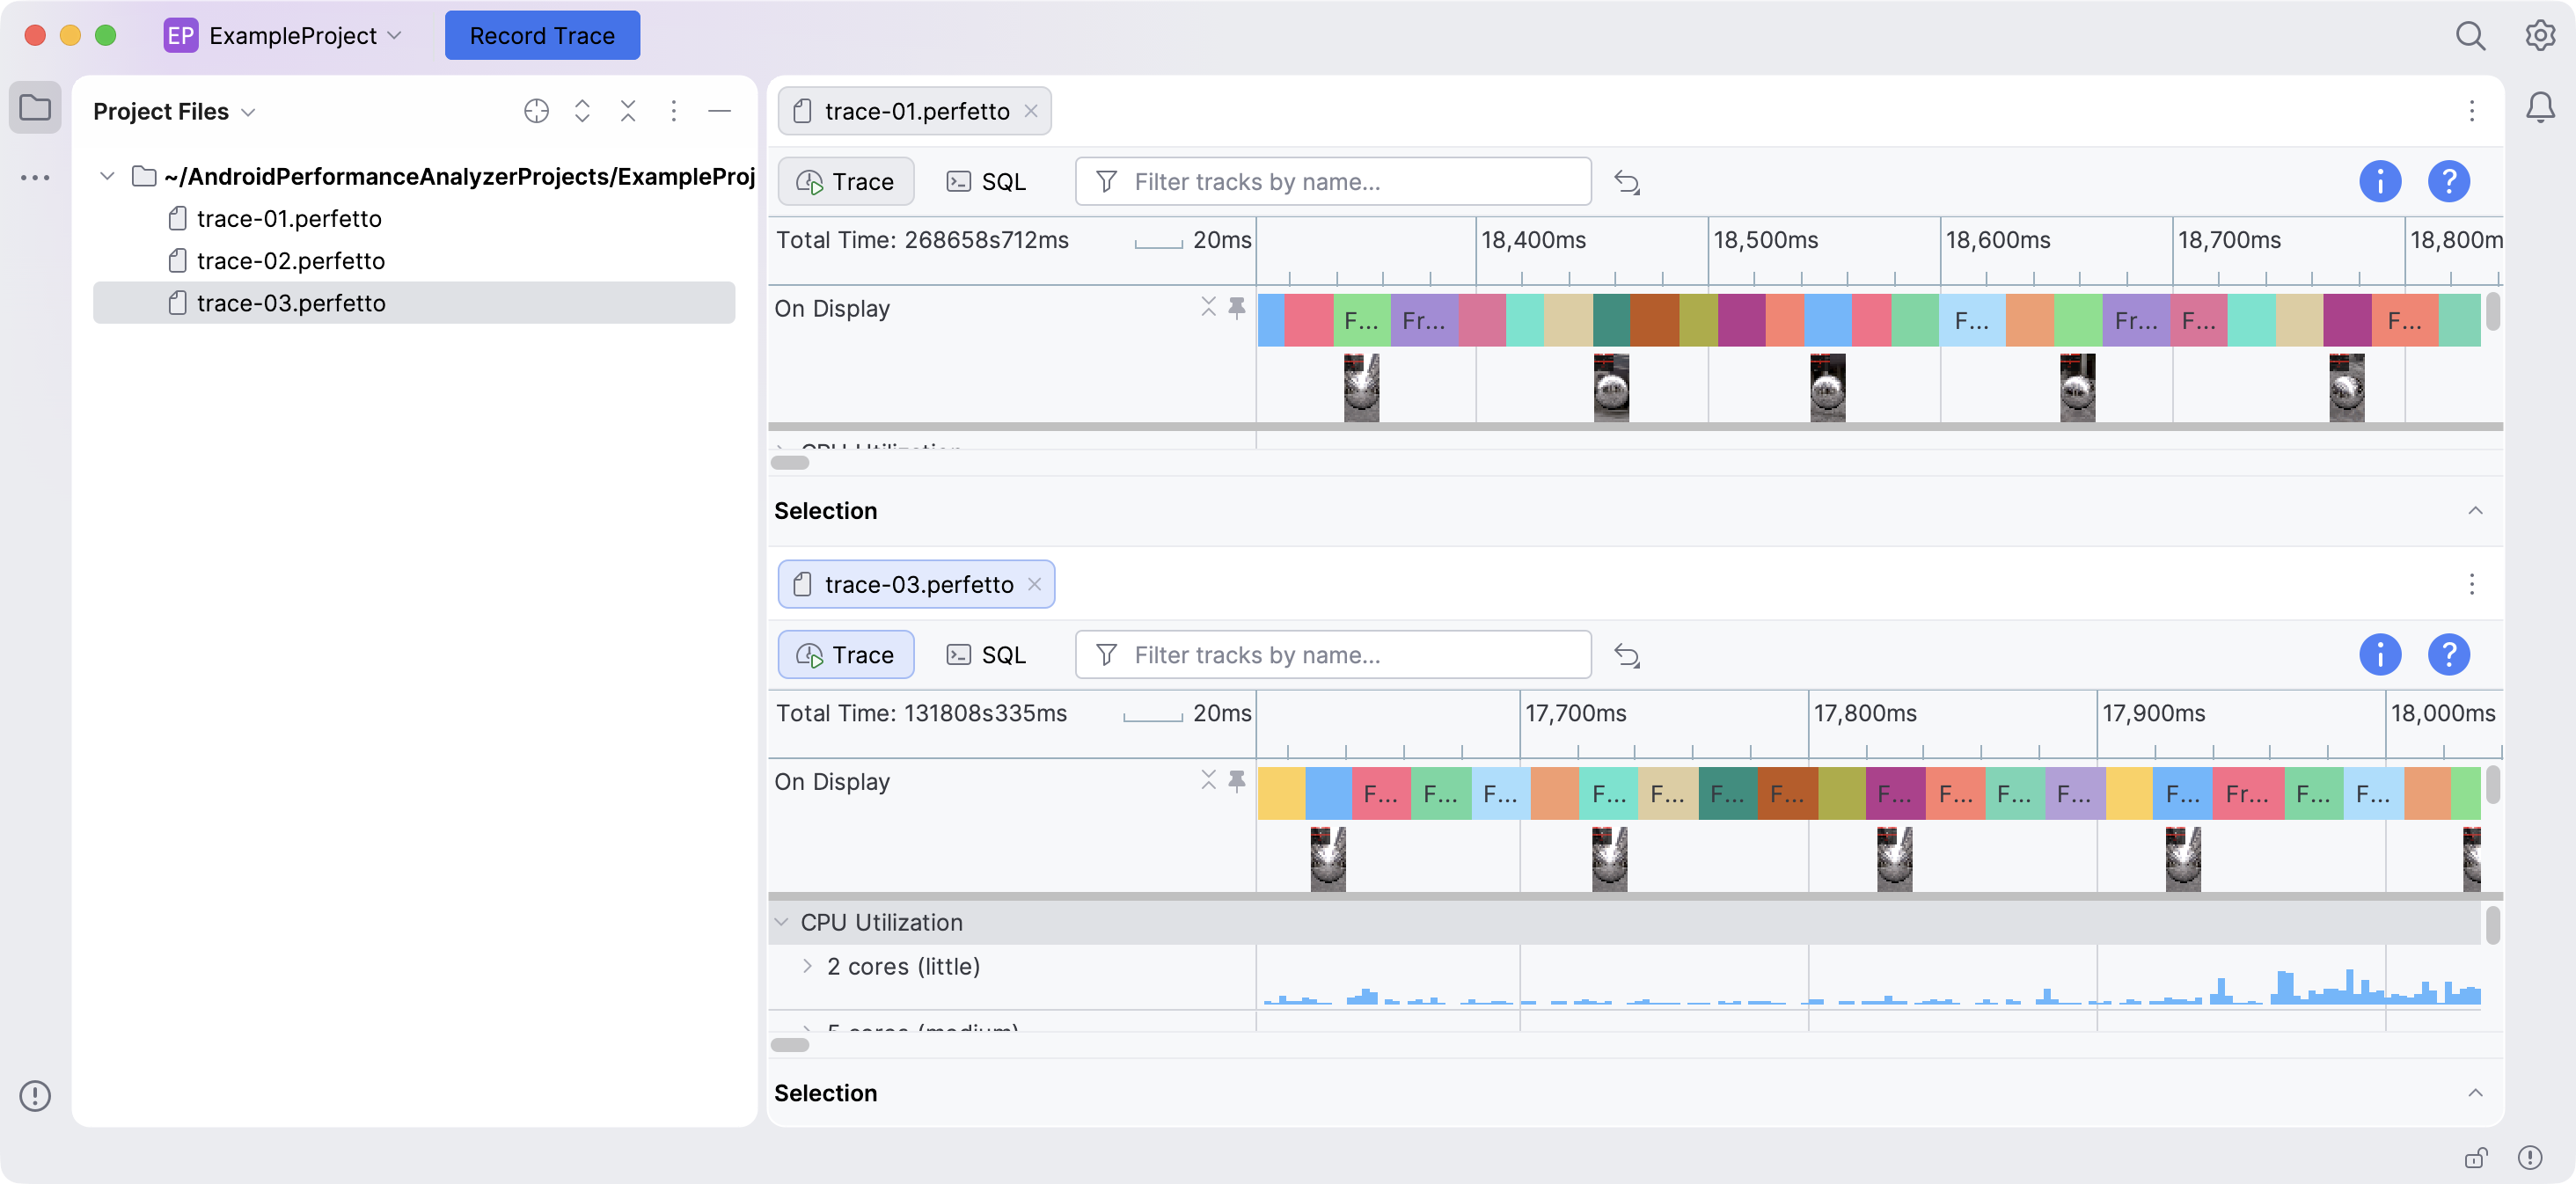
View multiple traces
Android Performance Analyzer inherits UI functionality from the IntelliJ platform, which means that you can open multiple trace files simultaneously using tabs, windows, or split views.
One particularly helpful use case for this functionality is opening two trace files in a vertical split view. This lets you line up timelines for direct visual comparison.
Customize the trace view
The trace view also provides ways for you to customize it for maximum usefulness in your workflow.
Pin and unpin tracks
Pinned tracks appear at the top of the trace view and remain visible as you scroll down through the available tracks. You can pin a track by clicking the pin icon that appears when you hover over its name bar. To unpin a track, click the pin icon again.
Expand and collapse tracks
Some tracks can be expanded to provide more granular detail or collapsed to take up less space.
Add or remove bookmarks
You can bookmark specific points in the timeline by clicking them in the timeline bar at the top of the trace view. Each bookmark displays a line extending through all of the tracks in the trace view. You can toggle the visibility of each bookmark by clicking the corresponding flag on the timeline bar, or remove a bookmark entirely by right-clicking its flag.
State persistence
When you close a trace view, the System Profiler saves your pinned tracks, bookmarks, zoom level, and scroll position. The next time you open the same trace file, the trace view's state is restored.
To clear your bookmarks, reset your pinned tracks to the default, or both,
click
![]() Reset Options.
Reset Options.
Run custom queries
You can click
![]() SQL in the top-left corner of the trace view to open the SQL tab.
SQL in the top-left corner of the trace view to open the SQL tab.
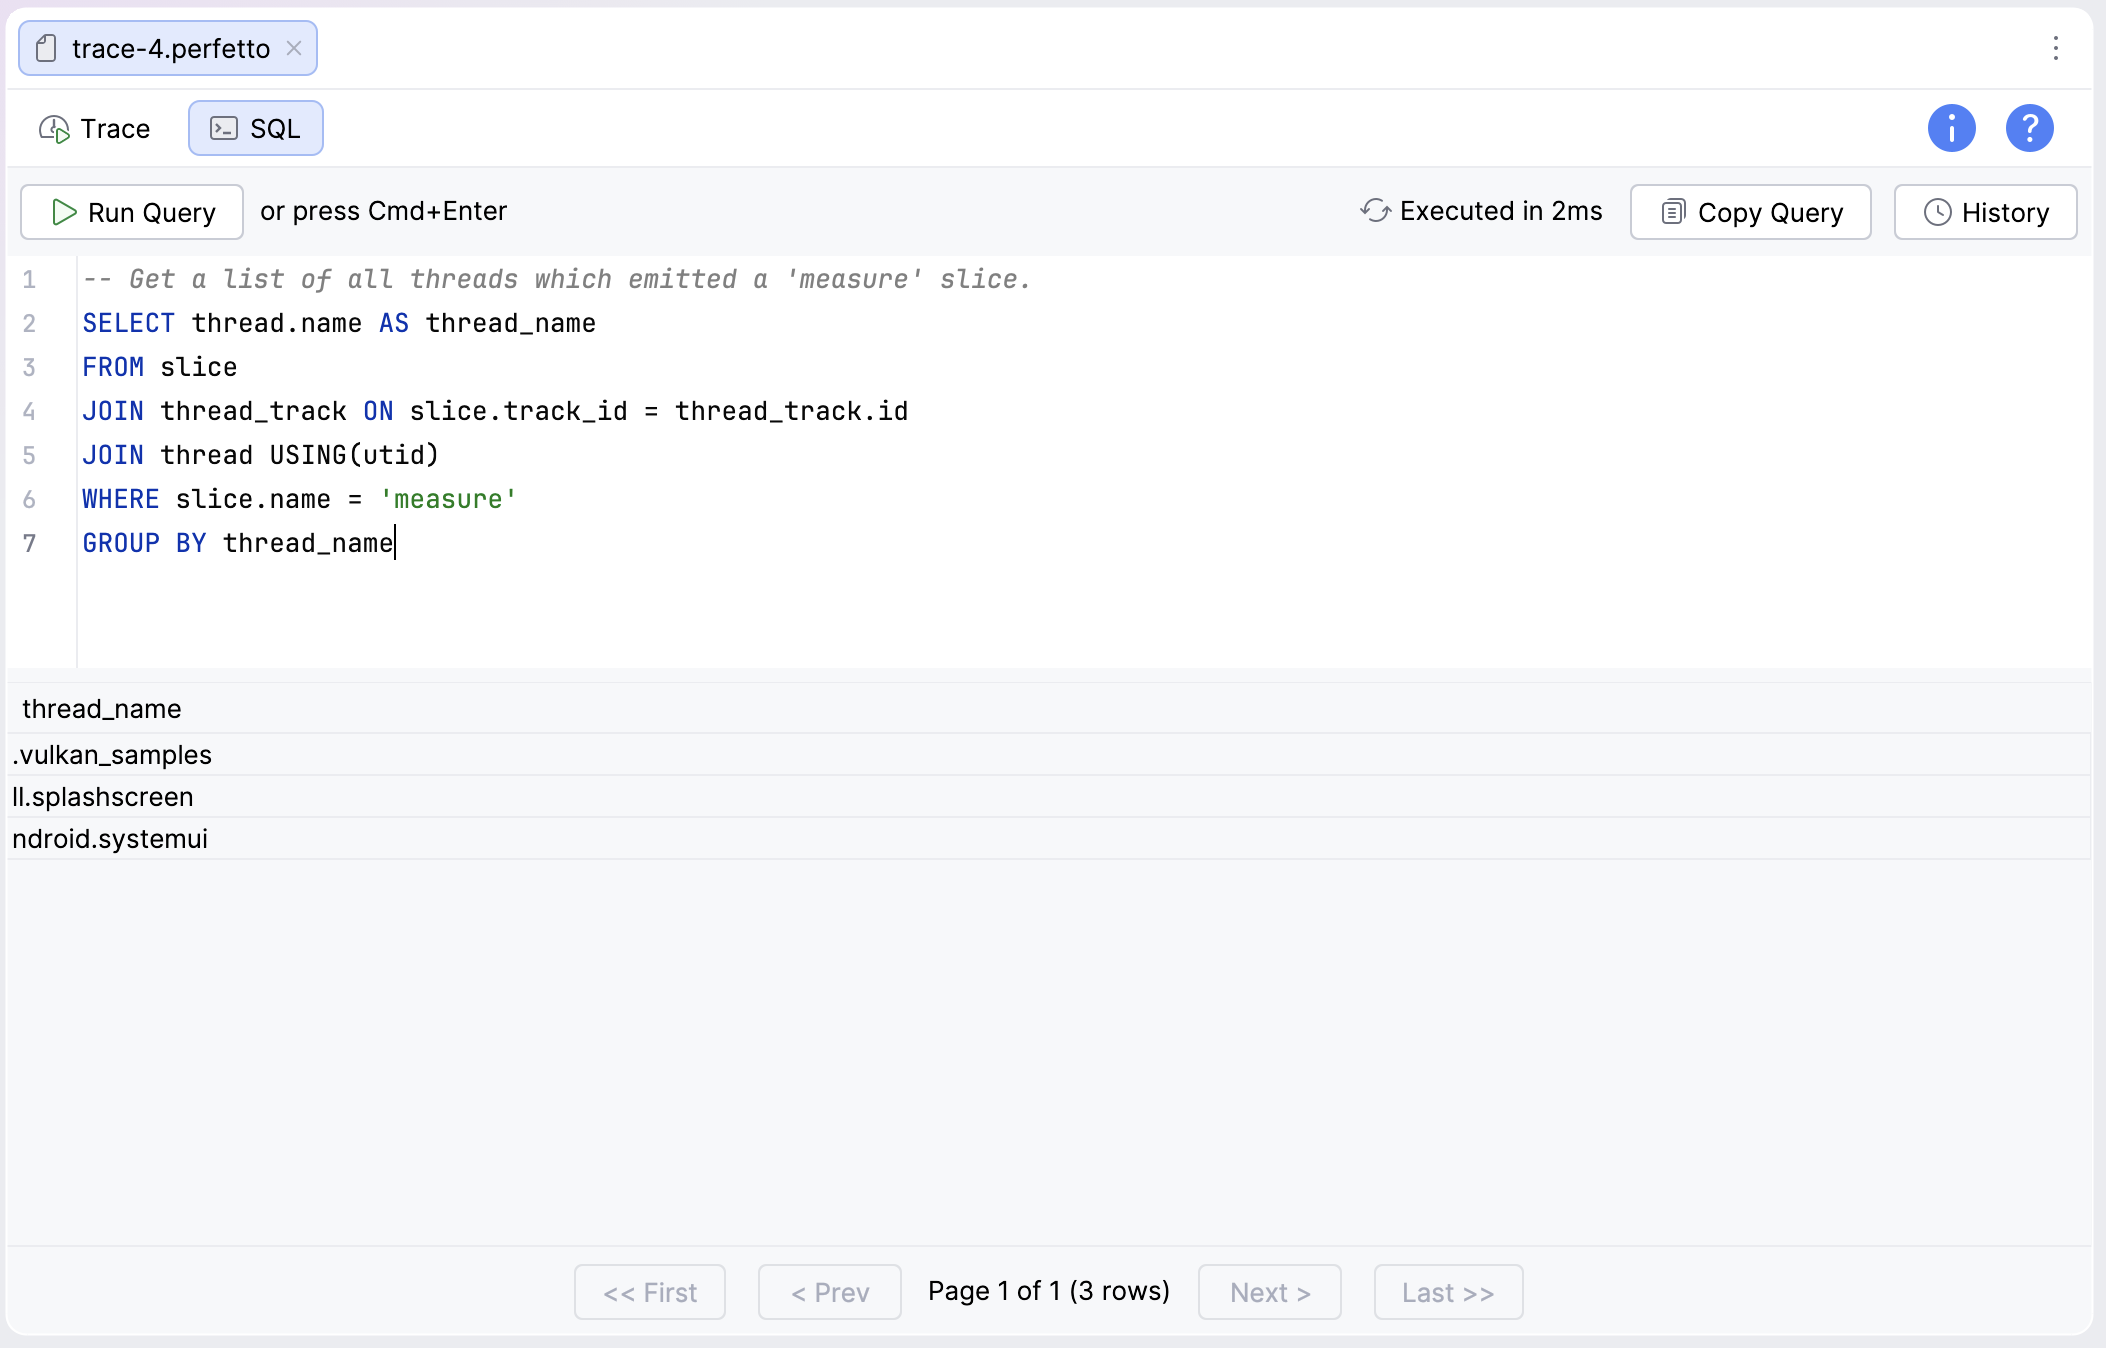
In the SQL tab, you can write custom PerfettoSQL queries for personalized analysis.
- Click
 Run Query or press Ctrl+Enter
(Cmd+Enter on macOS) to run the query.
Run Query or press Ctrl+Enter
(Cmd+Enter on macOS) to run the query. - Use the navigation buttons at the bottom if your query results extend onto multiple pages.
- Click
 Copy Query to copy the contents of the query window to the clipboard.
 - Click
 History for a scrollable dropdown list of queries executed previously.
Query history is shared across trace files and projects.
History for a scrollable dropdown list of queries executed previously.
Query history is shared across trace files and projects. - Click
 Trace in the lop-left corner to return to the trace view.
You can also let your preferred AI agent write a query for you. See Use AI to build custom queries for more information.